This application note is a shortened version of the article “An analysis of the acoustic cavitation noise spectrum: The role of periodic shock waves” by Jae Hee Song, Kristoffer Johansen, and Paul Prentice, used under CC BY.
1 Introduction
Research on applications of acoustic cavitation is often reported in terms of the features within the spectrum of the emissions gathered during cavitation occurrence. There is, however, limited understanding as to the contribution of specific bubble activity to spectral features, beyond a binary interpretation of stable versus inertial cavitation. In this work, laser-nucleation is used to initiate cavitation within a few millimeters of the tip of a needle hydrophone, calibrated for magnitude and phase from 125 kHz to 20 MHz. The bubble activity, acoustically driven at f0¼ 692 kHz, is resolved with high-speed shadowgraphic imaging at 5 million frames per second. A synthetic spectrum is constructed from component signals based on the hydrophone data, deconvolved within the calibration bandwidth, in the time domain. Cross correlation coefficients between the experimental and synthetic spectra of 0.97 for the f0/2 and f0/3 regimes indicate that periodic shock waves and scattered driving field predominantly account for all spectral features, including the sub-harmonics and their over-harmonics, and harmonics of f0.
2 Experimental configuration
The experimental arrangement depicted in Fig. 1(a) is used to study cavitation in unprecedented detail, both optically and acoustically. High-intensity focused ultrasound (HIFU) is generated via a single element piezoceramic transducer (H-149, Sonic Concepts, Bothell, WA), connected to a power amplifier (2100L, Electronic and Innovation, Rochester, NY), and a waveform generator (DG4102, Rigol Technologies, Beijing, China). The HIFU transducer has a natural fundamental frequency at 200 kHz, however, for the current work it is driven at the third harmonic through an impedance matching network, such that f0 = 692 kHz for all results presented. This driving frequency is chosen so that acoustic cavitation emissions are well within the calibration bandwidth of the needle hydrophone (NH, 1.0 mm diameter, PVdF, Precision Acoustics, Dorchester, UK). A 20 mm central hole, through the body of the transducer, serves to mount the NH, aligned vertically along the HIFU axis, Fig. 1(a), with the tip located around the pre-focus -6 dB contour, ~3 mm from the focal point. We refer to this orientation as the “emission collection” position, Fig. 1(b). The NH is connected to an oscilloscope (MS07104A, Agilent Technologies, Lexington, MA).
 Figure 1. Illustration of experimental setup: (a) cross-sectional side view, and (b) an axial scan of the HIFU focal region, with representations of the NH outlined for “emission collection”
position (solid black)
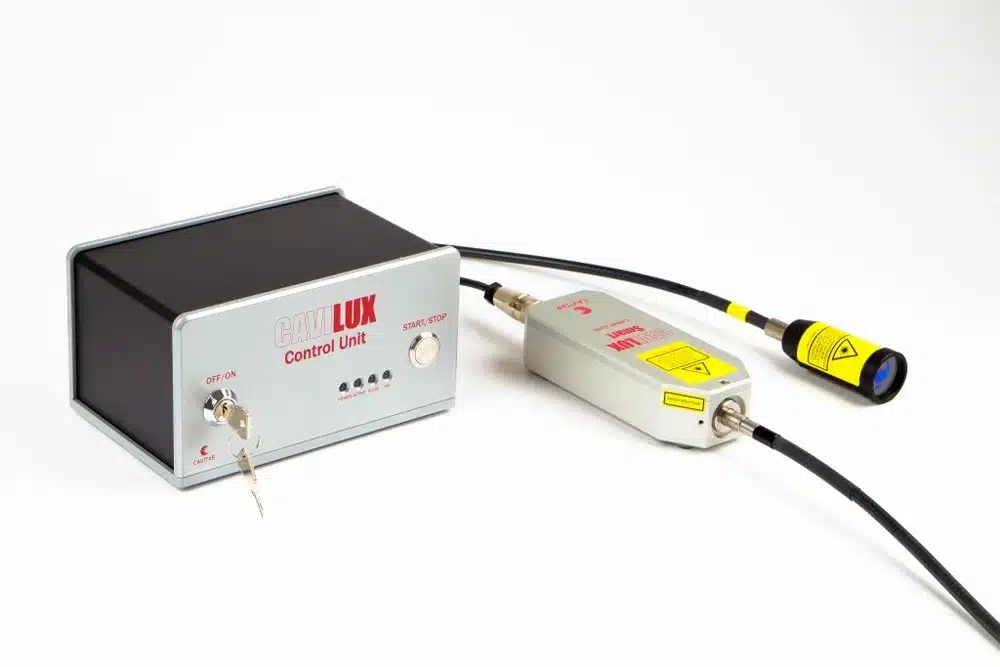
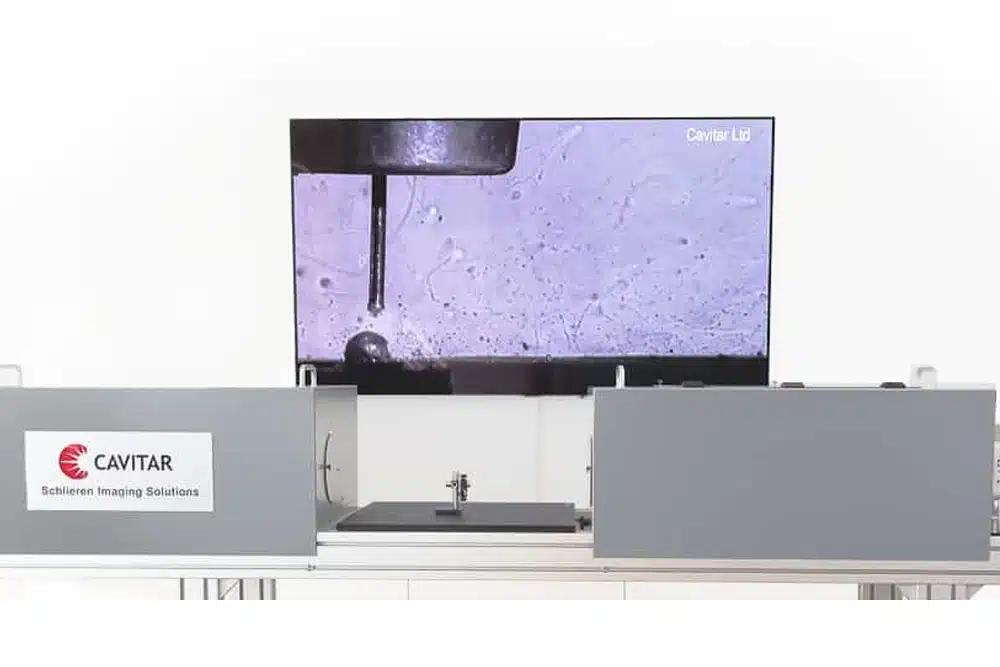
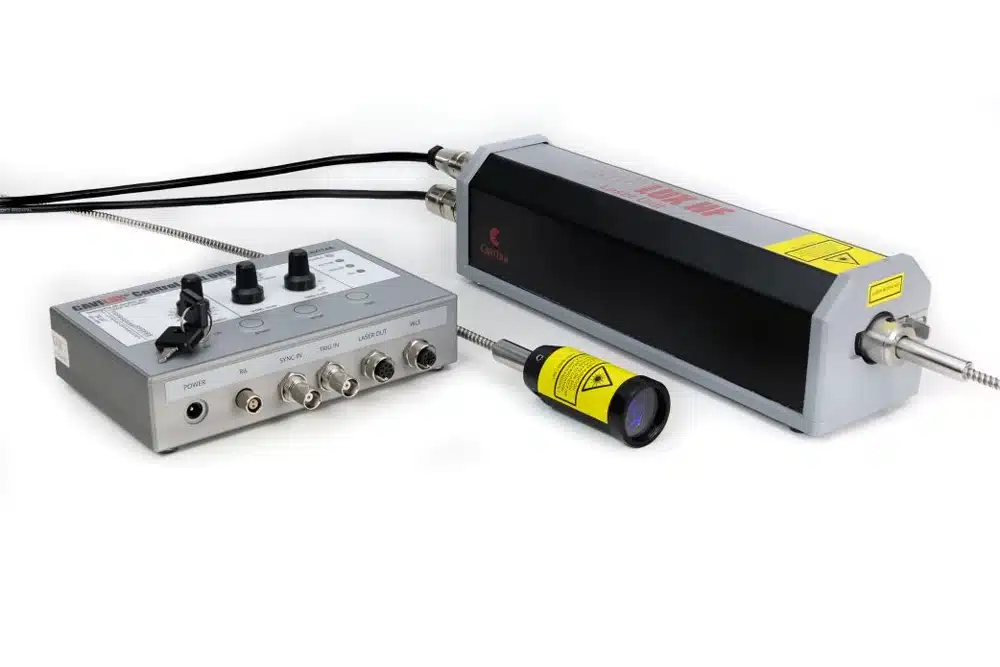
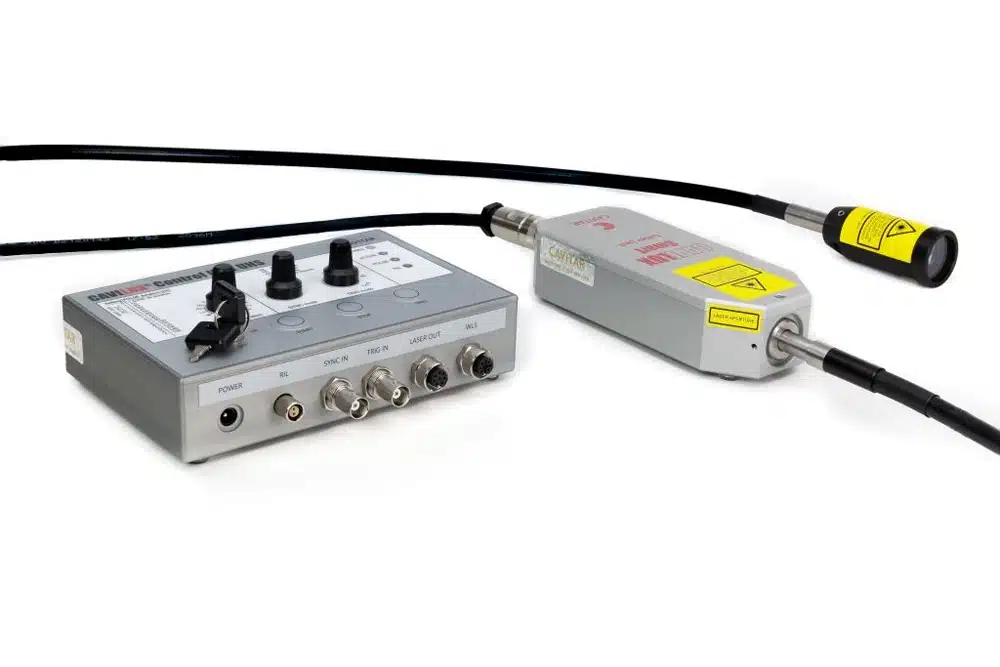
To precisely initiate cavitation activity relative to the NH tip, and in the HIFU focus, we employ the lasernucleation technique. A single 1.2 ± 0.1 mJ (instrument error according to manufacturer), 6–8 ns laser pulse (Nano S 130-10 frequency doubled Q-switched Nd:YAG, Litron Lasers, Rugby, UK), is passed through a long working distance microscope objective lens (50 0.42 NA Mitutoyo, Kawasaki, Japan), submerged in a sealed unit, mounted on an xyz manipulator (Velmex Motor, Bloomfield, NY), and pre-aligned to the HIFU focus, ~3 mm above the NH tip in situ. The laser pulse, triggered to be incident ~5 cycles into a 65-cycle burst of HIFU, generated the cavitation activity reported below. The transducer-NH configuration is housed within a custom-built chamber, measuring 420 x 438 x 220 mm3 and filled with degassed, deionized water. Two of the walls of the chamber are recessed, to allow the placement of imaging optics in proximity to the intended location of the cavitation, facilitating reasonably high spatial resolution imaging. High-speed shadowgraphic imaging of the resulting cavitation activity is undertaken orthogonally to the nucleating laser axis, through a Monozoom 7 lens system (Bausch & Lomb, Rochester, NY), at 5 million frames per second (HPVX2, Shimadzu, Kyoto, Japan), with synchronous 10 ns laser pulses (CAVILUX Smart, Cavitar, Tampere, Finland) providing the illumination and effective temporal resolution, per frame. A delay generator (DG535, Stanford Research Systems, Sunnyvale, CA) provides electronic triggering to synchronize each of the instruments. The Q-switch of laser, which is detected by the NH, signifies laser pulse emission and cavitation nucleation, and is taken as t = 0 µs.
3 Results of high-speed imaging and needle hydronephone data
Figures 2(a)–2(c) represent high-speed imaging data captured for cavitation driven by a PPPAHIFU = 1.63 ± 0.12 MPa. The activity appears to consist of a single bubble, undergoing pseudo-spherical oscillation, with alternating strong collapses coincident to shock wave emission at f0=2, captured Fig. 2(b) at 8.25, 14.05, 17.05 µs and arrowed, Fig. 2(c), and intervening partial deflations. It is known that for shadowgraphic imaging of acoustic transients, the focal plane for best resolution of the pressure fluctuations is slightly removed from the plane within which the emitting bubble is located. For this reason, the bubble of Figs. 2(a) and 2(b) is slightly out of focus, and the bubble oscillation is not optimally resolved.

Figure 2. Images extracted from a high-speed sequence recorded at 5 mio fps, of cavitation activity in the f0/2 regime. (a) The whole field of view, depicting the NH tip position relative to the activity, with a shock wave (arrowed white) incident to it. (b) Selected images representing the cavitation oscillation dynamics, including three strong collapses, and coincident shock wave emission. The entire image sequence is available, in movie format, as supplementary material. (c) Radius-time curve based on a dark pixel counting algorithm, for the time interval under investigation. Diamond and squares indicate the specific images represented in (a) and (b), respectively.
Scale bar represents 250 µm.
Nonetheless, the data confirm the cavitation behavior reported previously, for a HIFU-cloud system in the f0=2 regime. Figure 2(c) represents the bubble radius variation with time, graphically, determined from the entire image sequence captured for this experiment. Figure 3(a) is the raw voltage signal collected by the NH in the emission collection position. A control experiment, for which the HIFU burst was generated, but no laser pulse incident to nucleate cavitation, is also represented. Subtraction of the control, and NH deconvolution within the calibration bandwidth generates Fig. 3. Figures 3(b) and 3(c) show the cavitation emission signal and the cavitation emission spectrum respectively. There is a propagation time from each shock wave is emitted by the cloud and imaged during by high-speed data acquisition, Fig. 2, and detection at the needle hydrophone, Fig. 3, of ~1.8–1.9 µs, depending on the precise timing of cloud collapse and shock wave emission. The propagation distance can be measured from Fig. 2(a) as ~2.7 mm; however, neither the location of the sensing element within the shaft of the NH, nor the properties of the intervening material, are known. An average propagation speed of ~1520 ms–1 can, however, be inferred from the high-speed imaging of periodic shockwave propagation, and a short period of supersonic propagation may be assumed.
 Figure 3. (a) Raw NH data recorded during the cavitation activity of Fig. 2 (blue solid) and control exposure for an equivalent HIFU burst (red dot), without cavitation nucleation. The inset zoom around 19.0 µs, reveals a detected shock wave in the raw data, also arrowed for the rest of the trace. (b) Control subtracted and NH-deconvolved data, revealing the signal emitted by the cavitation captured in the high-speed imaging of Fig. 2.
(c) The cavitation spectrum obtained via Fourier transformation of (b).
4 Further studies by Glasgow University using CAVILUX
Deconvolution of acoustically detected bubble-collapse shock waves, Kristoffer Johansen, Jae Hee Song, Keith Johnston, Paul Prentice; Ultrasonics, Volume 73, January 2017, Pages 144–153.
Characterising focused ultrasound via high speed shadowgraphic imaging at 10 million frames per second, Kristoffer Johansen, Jae Hee Song, Paul Prentice (CavLab, Cluster of Ultrasound Science, Technology and Engineering Research, University of Glasgow, UK); Ultrasonics Symposium (IUS), 2016 IEEE International, Date of Conference: 18-21 Sept. 2016.
About the author
Jae Hee Song, Kristoffer Johansen, and Paul Prentice